

Latest Tenerife Weather Information
Other weather information at the same site: IAC GONG SONG
Weather information as of: 16/05/16 12:20:00
| Average wind speed | 1.37 | m/s (3.06 mph) | ||
| Wind direction | 211 | ° | ||
| Atmospheric pressure | 768 | mbar | ||
| External temperature | 10.25 | °C | ||
| Internal dome temperature | 15.69 | °C | ||
| Internal warm side temperature | 18.44 | °C | ||
| Raining | No | |||
| External humidity | 2 | % | ||
| Internal humidity | 5 | % | ||
| Star Count | 32.150000 | stars | ||
| Star Area | 848.033333 | |||
| Cloudy value | 0.000000 | |||
| Dew | -0.668746 | volts | ||
| Solar radiation | 8 | watts/square metre |
As of 15/02/16 08:57:50 the Tenerife site reports the weather is bad for observing.

The dark red, green and blue lines indicate the temperature values averaged over 10 minutes.
The light lines show the minimum and maximum values recorded in the sample intervals.

The dark blue and green lines indicate the wind speed averaged over 10 minutes.
The light lines show the minimum and maximum values recorded in the sample intervals.
If the green line is oscillating between 0 and 60 the sensor is indicating that
it is detecting nothing - i.e. it is frozen up or physically blocked.
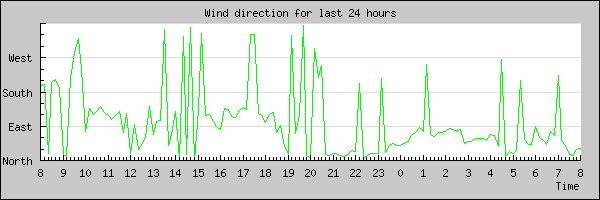
The green line indicates the wind direction averaged over 10 minutes.
If the green line is oscillating between the top and bottom of the graph the sensor
is indicating that it is detecting nothing - i.e. it is frozen up or physically blocked.

The dark blue line indicates the atmospheric pressure averaged over 10 minutes.
The light lines show the minimum and maximum values recorded in the sample intervals.

The dark red and blue lines indicate the humidity averaged over 10 minutes.
The light lines show the minimum and maximum values recorded in the sample intervals.
The humidity sensors are calibrated up to 95%, after which point they become saturated.

The line represents the number of stars counted by the star counting software looking
at images from the polestar camera. The dark line is the average over 10 minutes.
The lighter lines represent the minimum and maximum values.

The line represents the calculated total star area by the star counting software looking
at images from the polestar camera. The dark line is the average over 10 minutes.
The lighter lines represent the minimum and maximum values.

The line represents the star counting software's conclusion on whether it is cloudy,
looking at images from the polestar camera. The dark line is the average over 10 minutes.
The lighter lines represent the minimum and maximum values.

The dark green line shows the dew results averaged over 10 minutes.
The light lines show the minimum and maximum values recorded in the sample intervals.

Green areas on the graph indicate rain at that time.

The dark orange line indicates the solar radiation averaged over 10 minutes.
The light lines show the minimum and maximum values recorded in the sample intervals.

Red lines indicate weather rules triggering. Any triggered rule means the weather
is bad and the system does not observe.
Rules are as follows:
Rule 1: clouddetect_cloudy_rule
Rule 2: cloud_rule
Rule 3: humidity_rule
Rule 4: ice_rule2
Rule 5: light_rule
Rule 6: rain1_rule
Rule 7: rain2_rule
Rule 8: rain_rule
Rule 9: templow_rule
Rule 10: windgust1_rule
Rule 11: windgust2_rule
Rule 12: windgust3_rule
Rule 13: windhigh1_rule
Rule 14: windhigh2_rule
Rule 15: windhigh3_rule
Rule 16: sro_rule
Rule 17: sop_rule
Rule 18: observe

Approximate downtime in the last 24 hours: 0 minutes.
Approximate downtime in the last 7 days: 0 minutes.
Approximate downtime in the last 30 days: 0 minutes.